Forecasting
OpenRemote includes two types of time series forecasting methods for attributes, one quick and simple, based on weighted exponential averaging, the other using a machine learning based non-linear regression model.
Additional energy domain specific forecasting for power generation of solar panels and wind turbines are explained in the Tutorial: Create your Energy Management System.
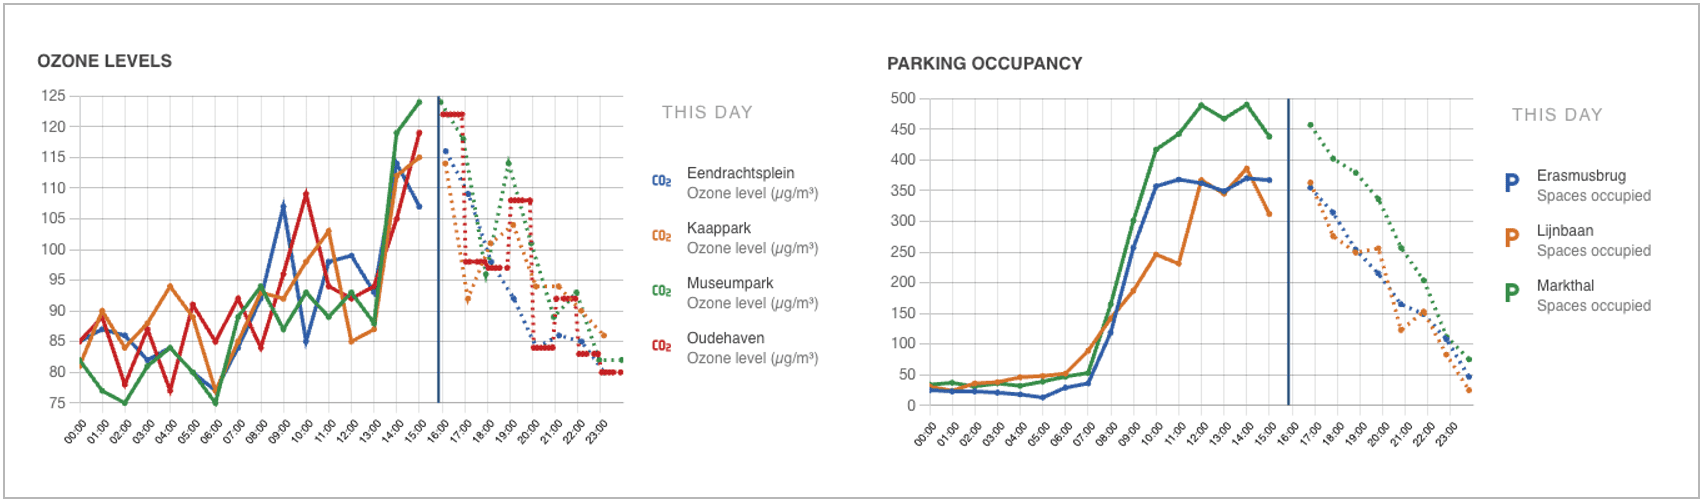 Examples of time series forecasting which allows recognising patterns with a repetitive character, e.g per 24 hour or also per day of the week
Time series with weighted exponential averaging
In many cases you have data with a straightforward repeating daily or weekly pattern. Examples are the temperature in a room (similar every day at the same time) or number of occupied office parking places (similar every weekday at the same time). For those types of time series data, you can apply simple WEA based forecasting for attributes.
To add this forecast and store it, you can add the two configuration items 'Has predicted data points' and 'Forecast'. For the 'Forecast' you will need to add five parameters in a JSON format:
- Type: the method applied, currently only weighted exponential averaging is available ("wea")
- Past period: the length of the period(s) in the past of which values are used to calculate the forecast ("P1D" for 24 hours or "P7D" for 7 days)
- Past count: the number of past periods taken into account (can be an integer of 1 or higher, 1 means it takes the value of one 'past period' back)
- Forecast period: the periodic intervals at which the forecasted values are calculated ("PT1H" calculates a data point for every hour in the future)
- Forecast count: the number of data points calculated (can be an integer of 1 or higher, 24 means 24 hours if the 'forecast period' is 1)
An example to be filled in for the 'Forecast' configuration:
{
  "type": "wea",
  "pastPeriod": "P1D",
  "pastCount": 4,
  "forecastPeriod": "PT1H",
  "forecastCount": 24
}
Note that the definitions for time use ISO8601 standards:
For "pastPeriod" the representation for
- Y is the year designator that follows the value for the number of calendar years.
- M is the month designator that follows the value for the number of calendar months.
- W is the week designator that follows the value for the number of weeks.
- D is the day designator that follows the value for the number of calendar days.
For "forecastPeriod" the representation for
- H is the hour designator that follows the value for the number of hours.
- M is the minute designator that follows the value for the number of minutes.
- S is the second designator that follows the value for the number of seconds.
Time series with non-linear regeression model
For more advanced time series forecasting where you expect a seasonal effect as well as (non) linear relations with other attributes. You can use the ML Forecasting service. An example is the amount of energy required for heating a building, as you would expect a dependancy on the outdor temperature and even the windspeed. For more information about this service, check the ML Forecasting Service