ML Forecasting Service
The ML Forecasting Service is an optional service that applies machine learning and statistical models to time series forecasting. It lets you create forecast configurations for attributes with historical data. Currently, it supports Prophet, an additive regression model which is known for its ability to efficiently capture trends, seasonality and holidays effects. Additional models will be supported in future releases.
This service is not installed by default. It can be installed by your administrator by following the instructions in the External Services page.
Features
- Create forecast configurations for any attribute that has historical data
- Forecasts are automatically generated at a specified interval
- Manage forecast configurations in the UI
- Fine-tune the configuration by adjusting model parameters
- Generated forecasts can be viewed as predicted data points when visualized via the Insights UI
Accessing the Service
To access the service, you must first navigate to the Services page in the Manager UI.
If the service is properly installed, you will see the ML Forecasting Service in the list of services.

Usage
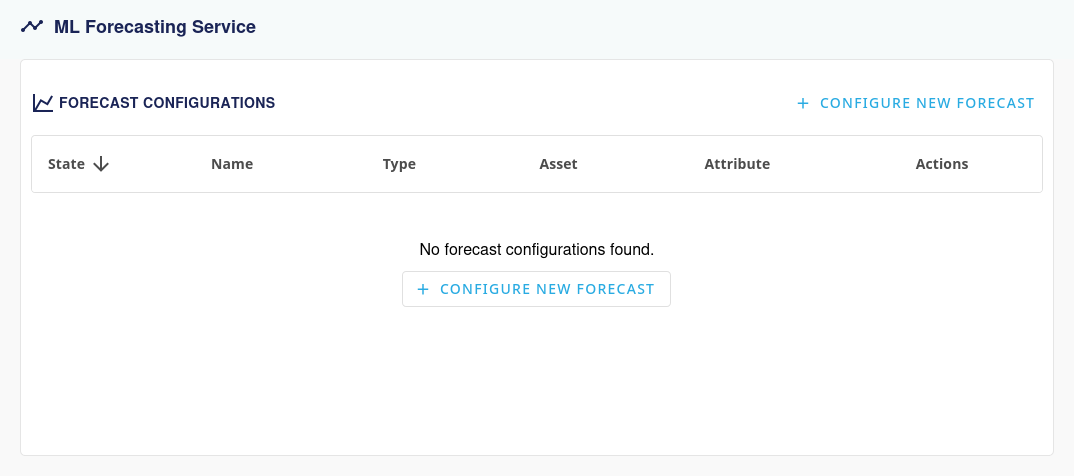
When the service is selected, you should see a list of forecast configurations. If none are present, you can create one by clicking the Configure New Forecast button.
You can then configure the forecast by filling in the form.
Configuration Form
The form contains sensible defaults for forecast generation, training, and model parameters. It is recommended to keep the Parameters fields at their defaults unless you have a specific reason to change them.
| Section | Field | Description |
|---|---|---|
| General | Name | The name of the forecast configuration |
Model Type | The model to use for forecasting | |
| Forecast Generation | Generate new forecast every | How often to create new predictions (increase if data changes quickly) |
Unit | Time measurement (hours, minutes, etc.) | |
Forecasted datapoints | How many future points to predict (more for long-term planning) | |
Time between datapoints | Gap between each predicted point | |
Unit | Time measurement for prediction gaps | |
| Forecast Target | Asset | The device or system with the data you want to predict |
Attribute | The specific data you want to predict | |
Training data period | How much past data to learn from (more for complex patterns, less if there has been a systemic change) | |
Unit | Time measurement (days, weeks, months, years) | |
| Model Training | Train model every | How often the system learns from new data (keep same as forecast generation) |
Unit | Time measurement for relearning | |
| Parameters | Changepoint range | How much of your data to check for changes (0.8 = 80%). Reduce if predictions are too jumpy |
Changepoint prior scale | How likely the system thinks changes will happen (0.05 = 5%). Increase for more flexible forecasts that adapt quickly to changes, decrease for smoother forecasts that ignore minor variations | |
Seasonality mode | How seasonal patterns work (additive or multiplicative). Additive applies fixed seasonal adjustments (e.g., +10 units in summer). Multiplicative applies percentage-based adjustments (e.g., +20% in summer) | |
Daily seasonality | Look for daily patterns. Enable for daily cycles (energy, temperature) | |
Weekly seasonality | Look for weekly patterns. Enable for weekday/weekend differences | |
Yearly seasonality | Look for yearly patterns. Enable for seasonal data (needs 1+ year history) | |
| Regressors | Asset | Asset containing the regressor attribute |
| (Optional) | Attribute | The attribute to use as a regressor |
Training data period | Historical period for regressor data (should match or exceed target training period) | |
Unit | Time unit for regressor training data |
Regressors can be added when there's a relationship between your target variable and other attributes. For example, when forecasting energy consumption, you might add weather data or solar production as regressors.
When using regressors, they must have predicted datapoints available for the entire forecast period. If a regressor doesn't have future data points, the forecast will fail. This means you'll need to either:
- Use another forecast configuration to predict the regressor values first
- Use another mechanism such as a custom rule or meta configuration to predict the regressor values
Saving Configuration
Once you've configured all fields, click the Save button to store the forecast configuration. The model will automatically train and begin generating forecasts according to your specified intervals. After this step, you can now safely navigate away from the configuration page.
Viewing the Forecast
Once the forecast is generated, you can view it in the Insights UI.
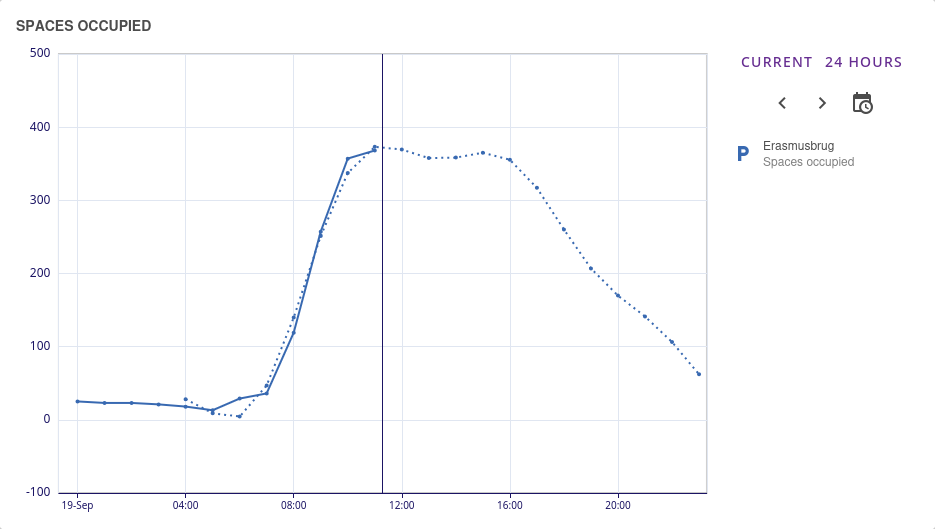
The forecast will be displayed as a dotted line in the chart.
Next Steps
Now that you understand how to set up and use the ML Forecasting Service, you can:
- Monitor the results in the Insights UI to verify forecast quality
- Experiment with parameters to optimize forecast accuracy for your specific use case
- Add regressors if you identify relationships between different data sources
- Add additional forecasts by creating additional configurations for other assets and attributes